
Approximating Jaccard similarity with MinHash
The MinHash method was invented by Andrei Broder, when he was working on Altavista search engine. This local sensitive hashing method is used for estimating similarity between documents in a scalable manner by comparing common word shingles. Yet the MinHash method can be used for any kind of problems where you need to find out Jaccard similarity of large sets.
Jaccard similarity
Jaccard similarity (a.k.a. Jaccard index, Intersection over Union or Jaccard similarity coefficient) is a measure to find similarity between two sample sets. It is defined as the size of the intersection divided by the size of the union of the sample sets. Let \(A\) and \(B\) be two sets and Jaccard similarity \(J\) is a measure such as:
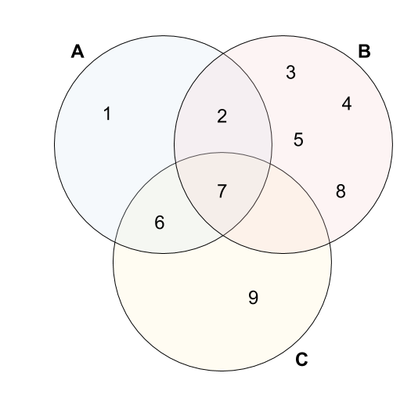
\[J(A,B) = \frac{|A \cap B|}{|A \cup B|}\]To demonstrate the method, let’s consider a toy example where we try to measure similarity between three fruit baskets in terms of common fruit types. We see the baskets as sets with distinct fruits:
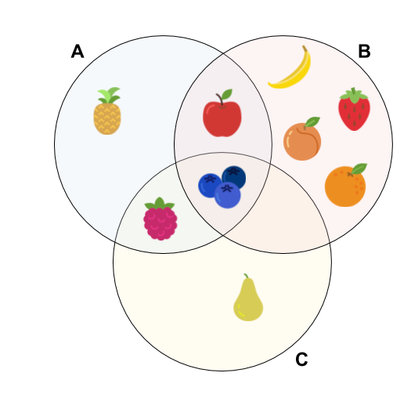
As the model shows, us we have 2 intersected fruits over 8 union between sets \(A\) and \(B\), so the Jaccard similarity for \(A\) and \(B\) yields:
\[J(A,B) = \frac{|A \cap B|}{|A \cup B|} = \frac{2}{8} = 0.25\]Moreover, we can fill a similarity table for all pairs of cells as following:
| A | B | C | |
| A | 1 | 0.25 | 0.4 |
| B | 0.25 | 1 | 0.125 |
| C | 0.4 | 0.125 | 1 |
This table demonstrates that, although \(A\) has 2 fruits in common with \(B\) as well as \(C\), \(A\) is more similar to \(C\) than to \(B\), because the Jaccard similarity is proportional to the union.
Fingerprint
Fingerprinting in computing implies mapping any kind of large input data into a bitwise smaller data. For our example, we are working with different fruits, but when we have many more types of fruits and large strings as inputs, it is not convenient to work with these large identifiers. Instead, we use a fingerprint to represent every object in the sets. For each fruit, the fingerprint should be ideally (virtually) unique data to represent them. (However, there can be collusion for two objects depending on fingerprint size, see Rabin fingerprint [Broder 1993] for a detailed real life example)
Now every fruit is represented as a smaller size data. We can easily store the elements in the set as 4 bit (\(2^4=16\) unique identifier). This would make sets easier to store and compute.
MinHashing
Now imagine a real life problem: instead of fruits in a couple of baskets, we compare every store on earth. Similarity measure between stores are defined as Jaccard similarity of distinct product sets. There are millions of stores with an average of thousands of product types. To find out the most similar grocery store to one of your favorites, you need to load all these sets and compute intersection and union sizes for each pairs. Instead of dealing with large sets, which requires a lot of computing time and memory, MinHash can provide a sketch to approximate this measure in a scalable way by computing a small fixed sized sketch which represents each large set.
Here is the intuition of this hashing method: let \(\pi\) be chosen to represent a random permutation function which permutes the set object data. In our toy example, we define the object data to be 4 bit, and lets consider every possible value for 4 bit data (0, 1, …, 15) and the permutation function \(\pi\) shuffles them. After permuting the set elements, the minimum value is picked.
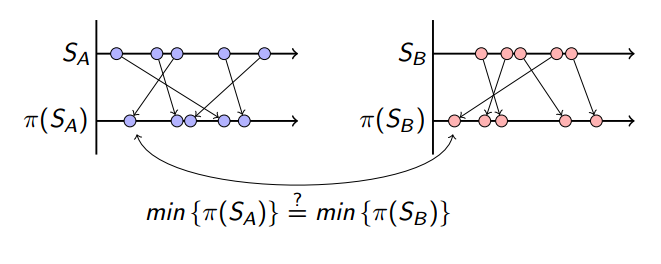
The chance of having the same minimum value after this permutation is equal to the number of common elements proportional to the union.
\[Pr(min\{\pi(S_A)\}=min\{\pi(S_B)\})= \frac{|S_A \cap S_B|}{|S_A \cup S_B|} = J(A,B)\]Since this is a probabilistic approximation of the actual value, having more of these function can increase the accuracy. We define how many of permutation function \(\pi\) we are gonna use and store the minimum value as sketch value. This count \(t\) would also determine our sketch size: the fixed size data to represent our set \(S_A\) as sketch \(\overline{S}_A\):
\[\overline{S}_A = (min\{\pi_1(S_A)\}, min\{\pi_2(S_A)\},...,min\{\pi_t(S_A)\})\]Back to our toy problem, we are going to use sketch size \(t=3\), that means we need 3 permutation functions like \(\pi\). Our set members are 4 bit integers \(0, 1,..., 15\), so the permutation function is such as \(\pi: \mathbb{Z}_{15} \rightarrow \mathbb{Z}_{15}\). Let our first permutation function \(\pi_1\) be:
\[\pi_1 = \begin{bmatrix} 2& 8& 6&14&11& 9& 3& 5&10& 4& 7& 0&15&13&12& 1 \\ 0& 1& 2& 3& 4& 5& 6& 7& 8& 9&10&11&12&13&14&15 \end{bmatrix}.\]This two-row notation defined \(\pi_1\) function maps 2 to 0, 8 to 1, 6 to 2, 14 to 3, … and so on. We are gonna apply this method into members of sets as following:
\[\begin{align} min\{\pi_1(S_A)\} & = min\{\pi_1(\{1, 2, 6, 7\})\} \\ & = min\{15, 0, 2, 10\} \\ & = 0 \end{align}\]For our sketch size \(t = 3\), we need additional permutation functions like:
\[\pi_2 = \begin{bmatrix} 3&15&13&11& 6& 8& 9& 0& 4& 7& 1&12&10& 5&14& 2 \\ 0& 1& 2& 3& 4& 5& 6& 7& 8& 9&10&11&12&13&14&15 \end{bmatrix}.\] \[\pi_3 = \begin{bmatrix} 12& 8& 3& 6& 9& 1&14&10& 7& 2& 5&13& 4&11& 0&15 \\ 0& 1& 2& 3& 4& 5& 6& 7& 8& 9&10&11&12&13&14&15 \end{bmatrix}.\]Now we can calculate the sketches for sets \(S_A\), \(S_B\) and \(S_C\) with permutation functions \(\pi_1\), \(\pi_2\) and \(\pi_3\).
\[\overline{S}_A = (min\{\pi_1(S_A)\}, min\{\pi_2(S_A)\},min\{\pi_3(S_A)\})\] \[\overline{S}_A = (0,4,3) \\ \overline{S}_B = (0,0,1) \\ \overline{S}_C = (2,4,3) \\\]We can use this sketch value to estimate Jaccard similarity by calculating how many permutation function returns the same minimum value between sets (Tanimoto coefficieny of arrays). Here is the approximated similarity table for MinHash sketches:
| \(\overline{S}_A\) | \(\overline{S}_B\) | \(\overline{S}_C\) | |
| \(\overline{S}_A\) | 1 | 0.33 | 0.66 |
| \(\overline{S}_B\) | 0.33 | 1 | 0 |
| \(\overline{S}_C\) | 0.66 | 0 | 1 |
Conclusion
This particular toy example demonstrates that, we can find out the most similar set to A with only using smaller sized sketches accurately. Since this is a random permutation based approximation method, the accuracy can differ based on sketch size and permutation functions. Another advantage is that, when a new set \(D\) arrives, we only need to compute 3x4 bit sized sketch and compare them with other sketches to find out most similar to it.
References and further reading
- Aksakalli, C. G., & Welke, P. Minhashing for Graph Similarity Computation. 2016. [pdf]
- Broder, Andrei. Identifying and filtering near-duplicate documents. 2000.
- Broder, Andrei Z., et al. Min-wise independent permutations. 1998.
- Broder, Andrei. Some applications of Rabin’s fingerprinting method. 1993.